Lab meetings · journal clubs · classes · defenses
Research paper to PPT: numbers from your paper, outline first
Research paper to PPT without copying paragraph by paragraph: upload your paper as Word or PDF, or paste the abstract and sections, and the AI drafts a slide-by-slide outline in presentation order (background, methods, results, conclusions). Numbers are written as they appear in your paper, gaps are marked [TBD], and every number in the outline is checked against your source before you generate. Works for lab meetings, journal clubs, class presentations and defenses, exported as a high-quality, editable PPT.
2 credits per slide (≈ $0.04–$0.07, AI images included) · $9.9 taster pack for new accounts · Export PPTX, PDF or PNG
See the finished deck first
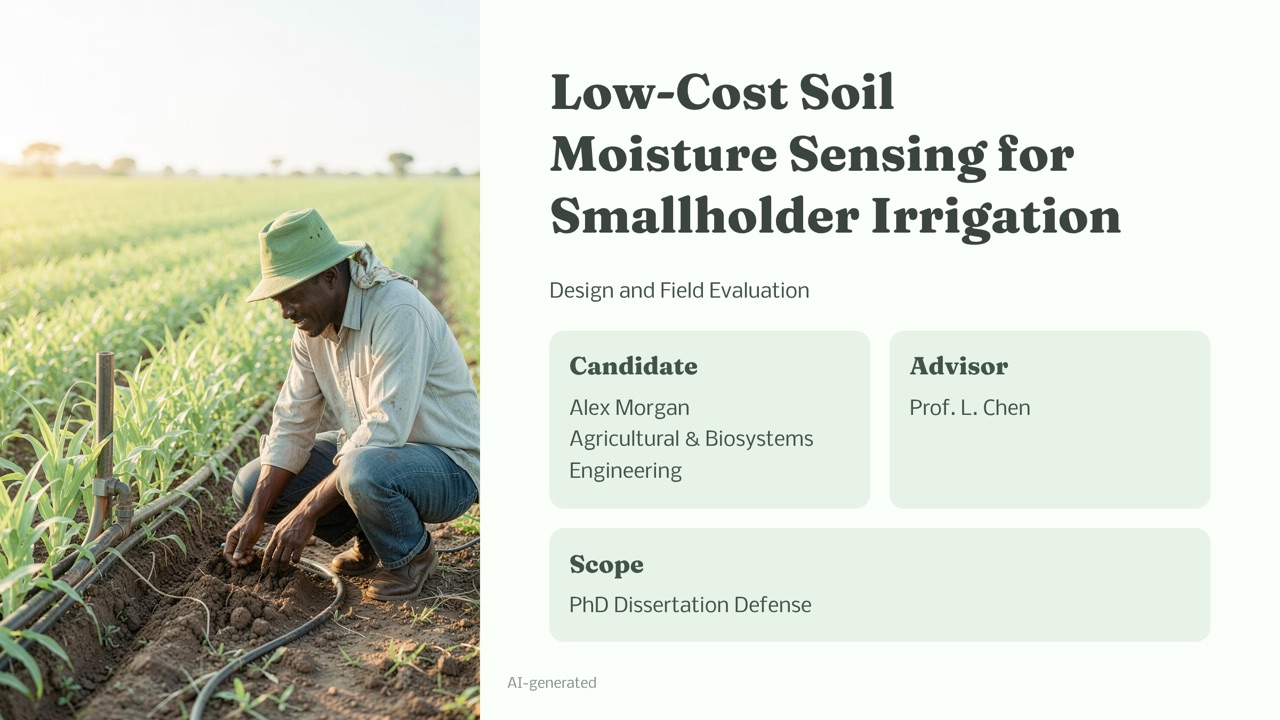
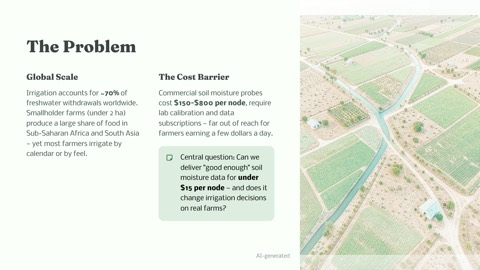
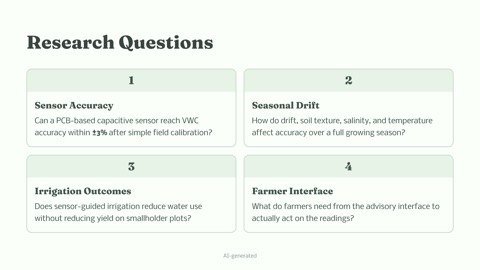
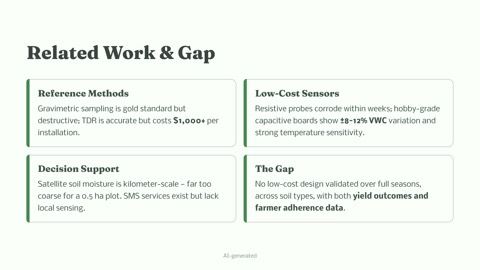
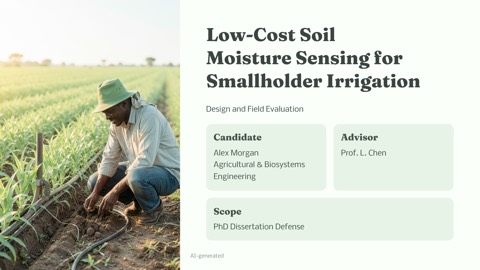
PhD Dissertation Defense: Low-Cost Soil Moisture Sensing for Smallholder Irrigation
12 slides · the example page shows the exact input
Research paper to PPT, from upload to finished deck
Upload Word or PDF
A .docx or a text-based PDF (read in your browser). Scanned PDFs have no text layer and can't be read, so run OCR or paste the text.
Edit the outline first
The AI lists each slide's title and points in presentation order; rewrite, reorder, add or delete slides. Outlines cost 0 credits.
Numbers checked against your paper
Numbers are written as in your paper and gaps are marked [TBD]; every number in the outline is checked against your source so you can review each one.
Export an editable PPTX
Real text boxes you can edit in PowerPoint or WPS, with PDF and PNG export too.
2 credits per slide, AI images included. You choose the slide count, and the cost is shown before you generate.
Upload my paperPreparing a thesis defense? Use the defense pack: a fixed defense structure, cover details and your school crest, plus a per-slide script and likely examiner questionsReal examples for this use case
Same input, one click — try it yourself. All examples are AI-generated with FlyPPT.





Sound familiar?
A long paper, a short slot
A thesis or a dense journal article, and ten minutes to present it. Deciding what goes on the slides and what you only say is the hard part.
Copy, paste, still a wall of text
Pasting the abstract and sections into slides, then fixing fonts and alignment, still leaves crowded slides nobody can follow.
One mistyped number
Retyping figures from your tables invites a slip, and someone in the lab meeting or on the committee will spot it.
Word & PDF to slides
Your numbers come from your document. Gaps are marked [TBD].
Upload a thesis, report or plan as Word or PDF and the AI turns it into a slide-by-slide outline: numbers are written as they appear in your source, and data your source doesn't have is marked [TBD] for you to fill in instead of being made up. Before you generate, every number in the outline is checked against your source.
- Green: the number is in your source — tap to see where
- Amber: not found in your source (e.g. a difference the AI worked out) — please check it
- Dashed blue: [TBD] — your source has no figure for this; fill it in or remove it
The check only looks at whether a number appears in your source; please still review meaning and units.
Your source (thesis excerpt)
Field test: over 4 weeks at 2 drop-off points, the system made 3,416 recognitions and sorting accuracy rose from 61.4% to 83.9%; 87% of surveyed students found it helpful.
The AI's outline (editable)
Number check: 1 not found in your source (marked amber); 4 match; 1 [TBD] to fill in
Field test results
- •Four-week pilot, 3,416 recognitions
- •Sorting accuracy: 61.4% → 83.9%
- •Accuracy up 22.5 percentage points
- •87% of students found it helpful
- •Projected users after a campus-wide rollout: [TBD]
In your source: …points, the system made 3,416 recognitions and sortin…
What you get
Research paper to PPT done the presentation way: one point per slide, results in your paper's own numbers, and gaps left for you to fill rather than guessed.
Slide structure
Paper title, authors, affiliation and date
Why the work matters and what it asks
Prior work and where this paper fits
Data, model or experimental design
Main results as tables or charts, numbers as in the paper
What the results mean and where they stop
Main findings and contributions
Next steps, or questions for the audience
Why it works
Numbers from your paper, gaps marked [TBD]
The AI organises what's already in your paper and doesn't make up data or references; figures your paper doesn't give are marked [TBD] for you to fill in or delete.
Every number checked against your source
Before you generate, numbers found in your paper turn green with the source passage a tap away; numbers not found are flagged amber for review. The check only looks at whether a number appears in your source, so still review meaning and units.
Upload Word or PDF
Upload a .docx or a text-based PDF, read in your browser. Scanned PDFs have no text layer, so run OCR or paste the text instead.
Editable PPTX
Choose 3 to 40 slides. Real text boxes you can edit in PowerPoint or WPS, with PDF and PNG export too.
Research paper to PPT in three steps
- 1
Upload your paper
Upload the .docx or PDF, or paste just the abstract, methods and results. Up to 100,000 characters per upload.
- 2
Edit the outline and length
Set 3 to 40 slides for your time slot, review the outline and the number check, then pick a style. Outlines cost 0 credits.
- 3
Generate and download
Ready in about 1–3 minutes. Export editable PPTX, PDF or PNG and refine it as you prepare.
Frequently asked questions
Research paper to PPT, so you can focus on the talk
Upload your paper, check the outline and the numbers, then generate a presentation you can deliver.